There’ s always more to learn
I agree with the sayings – ‘there’s always more to learn’ and ‘it’s never too late to learn.’
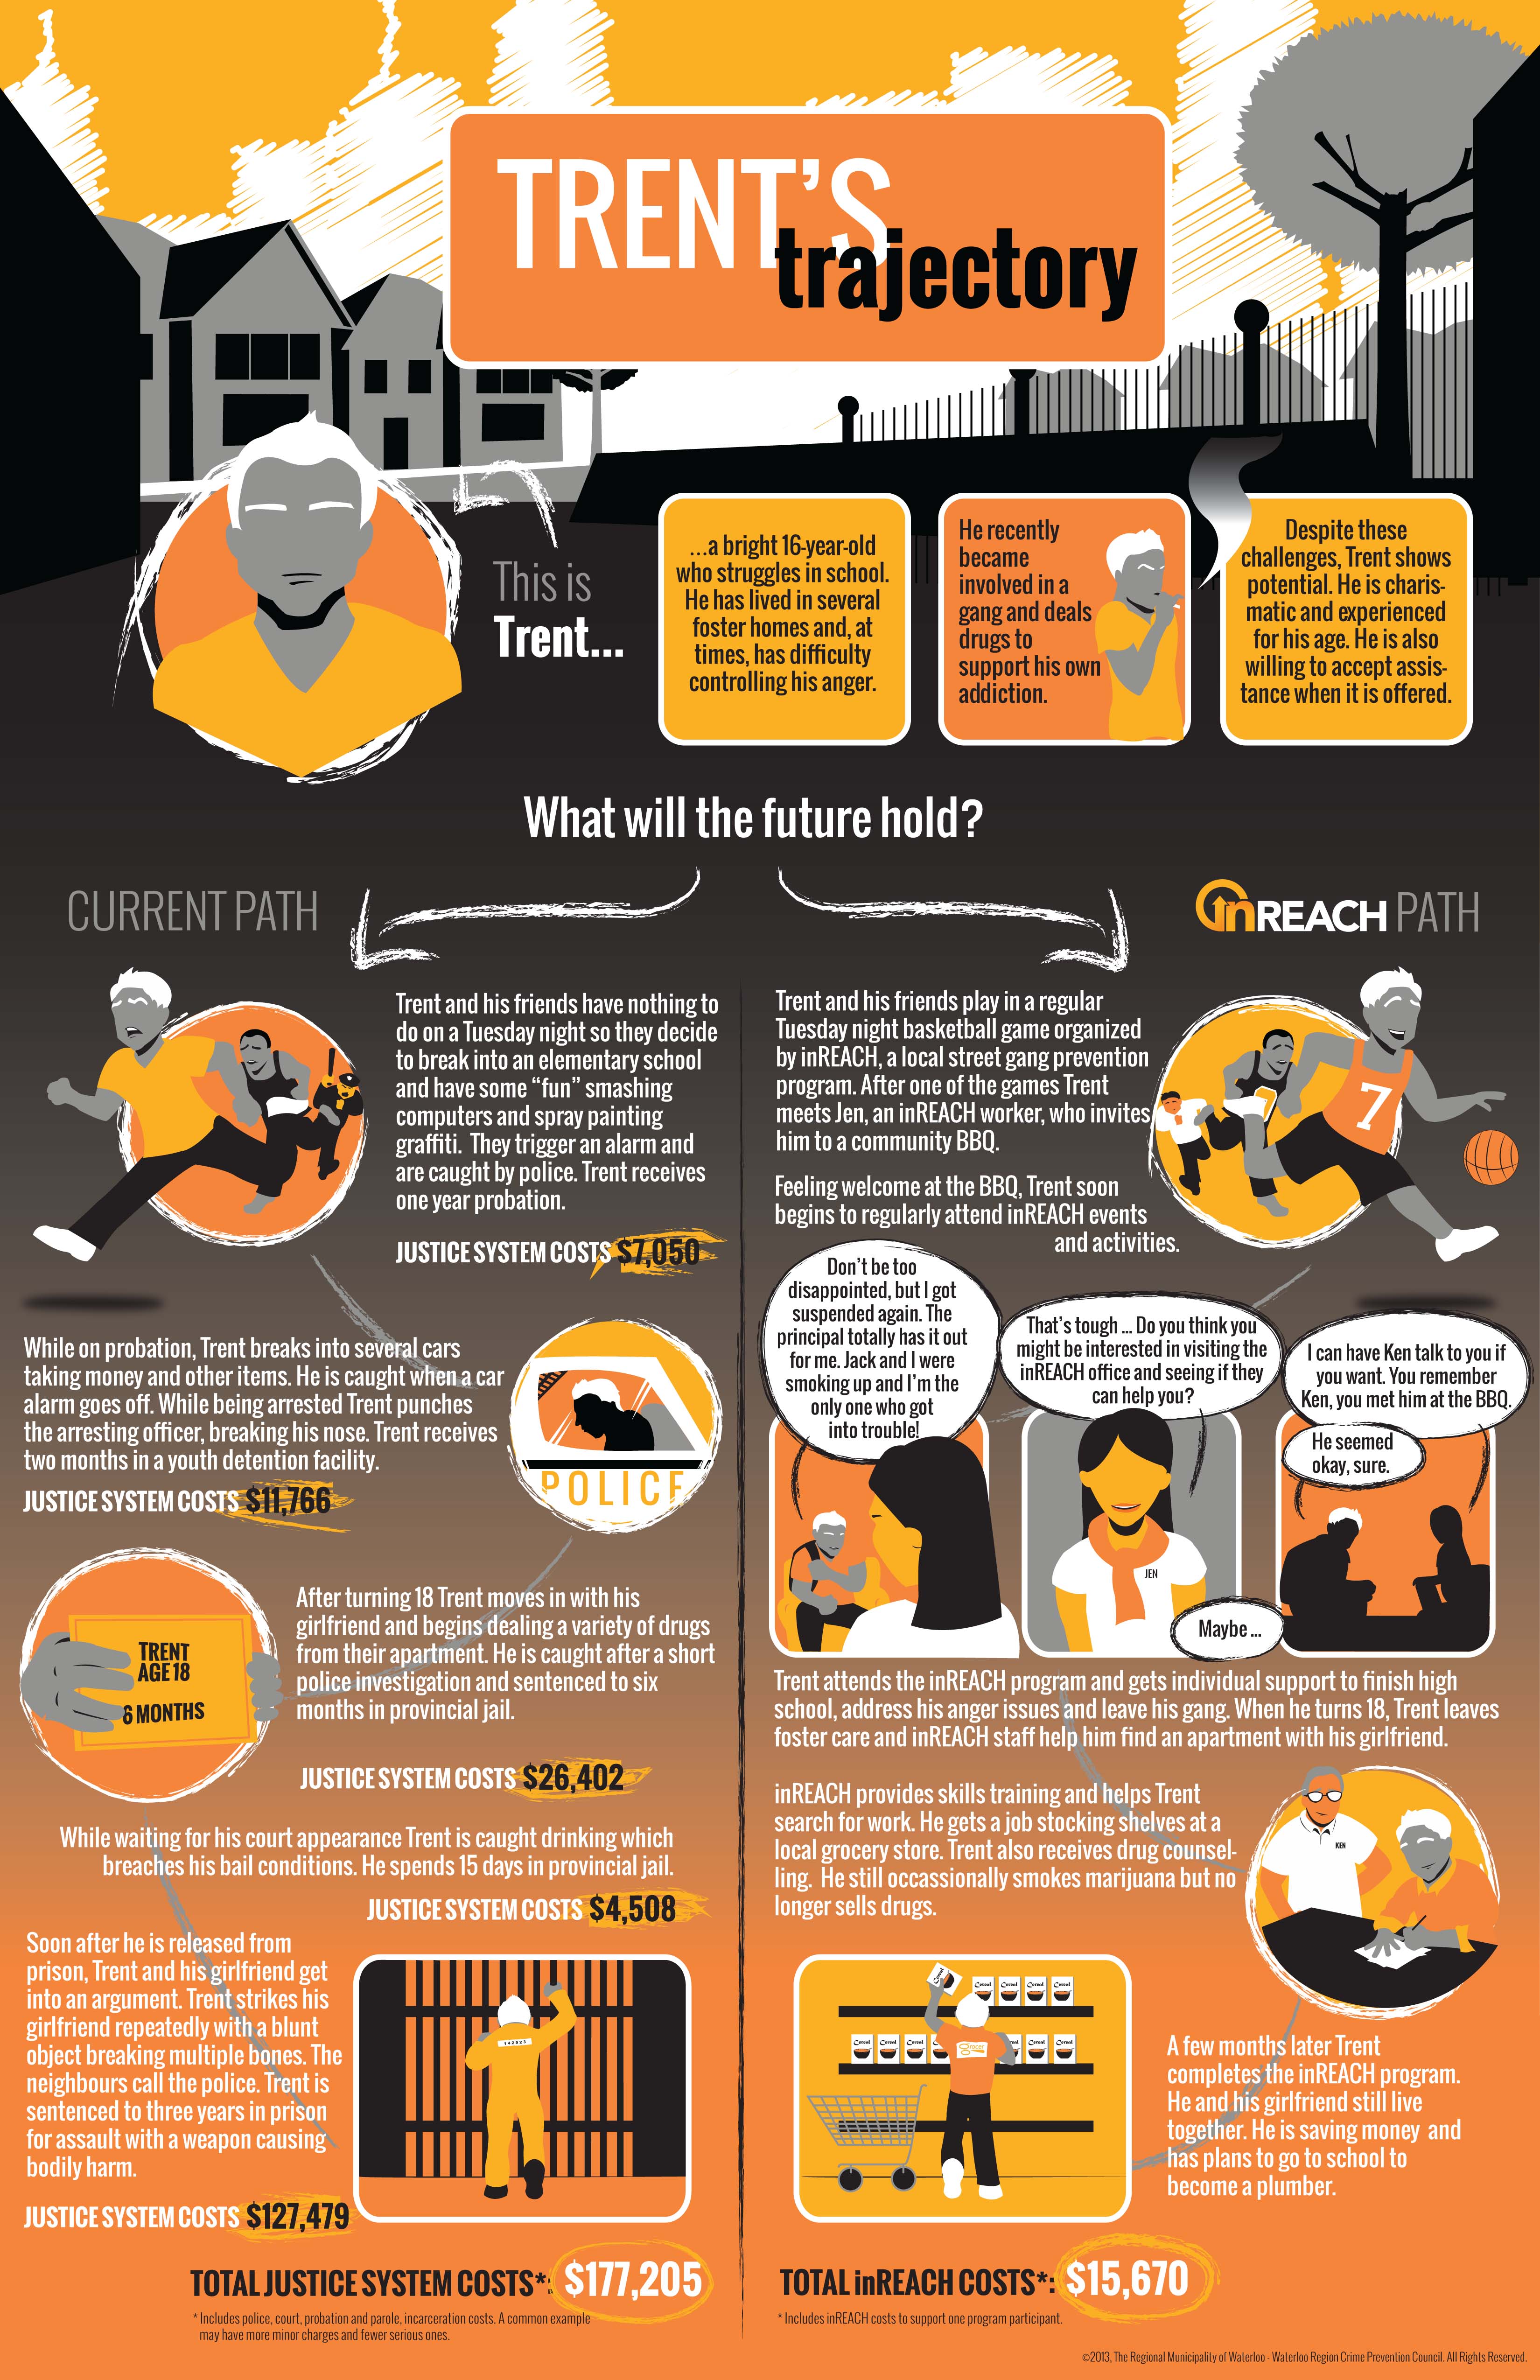
I lived this out when I returned to university for a Masters degree the same year my daughter started university. Luckily she wasn’t too embarrassed to be at school with her mom. My timing turned out to be perfect for another reason as well. During my time in school I had the amazing opportunity to be involved with the research and evaluation of the innovative and highly successful gang prevention project, inREACH. I can guarantee you; I learned something new every day.
An excellent summary of the evaluation report for inREACH highlights a LOT of really important learning and accomplishments as a result of this collective community effort over the past few years. Sharing our story: Lessons learned from the inREACH experience describes how the project was implemented, the young people it served in the treatment and prevention programs, and the many positive impacts of the project on young people, neighbourhoods, organizations and the community as a whole.
 The most important lessons and understandings learned from inREACH will inspire community action toward a future where all young people feel part of a caring community and have the opportunities and the supports they need and deserve. But, any evaluation isn’t even worth the paper it’s printed on if it just sits on a shelf. We need to apply the evaluation findings so that we can affirm what might already work but also make changes where needed.
It Works!
 Some believe that teenagers – particularly those labelled as “trouble” – don’t want to be involved in community activities or mentoring relationships with adults. The evaluation busts that myth by demonstrating very clearly – that if organizations and communities take the right approach – then many adolescents and young adults, will participate in asset building activities like arts and sports. Many will also seek assistance for challenges they face with things like addictions, gang involvement or finding a job or a home, when they have developed a trusting relationship with an adult who meets them ‘where they’re at.’ The evaluation results also clearly demonstrated that when young people got involved in their communities and received help with life challenges, they experienced many positive benefits and changes. Over 95 % of youth agreed their involvement “helped them move in the direction in life they wanted to go.” For example, youth said:
“they taught me to actually think before I acted…just keeping my cool overall and staying relaxed and not being so stressed out.”
“It helped me see the value of myself.”
Learning what it takes – with youth
 Sharing our Story describes key elements of the inREACH approach that was so successful. It took
- the development of trusting relationships between staff and young people;
- listening to the youth and involving them in decision-making,
- recognizing youths’ strengths, skills, and interests, and
- making programs and services more accessible.
The evaluation report fleshes out some details of HOW to implement these approaches, which is the challenging part.
One illustration follows:
“I don’t think that they have ever had an adult say “what are your dreams?” and “how are you going to achieve those?” and then try to help them… That is my biggest question when I first meet a kid….it gets them thinking…. Then believing in them too and showing them you really care.” (Project staff)
Learning what it takes – the community’s role
inREACH was a collaborative venture of multiple organizations. The evaluation documents how these partnerships enabled organizations to work together more effectively, to work with youth in a different way, to access more services and resources and to “produce systemic change – changes in the way systems and organizations in the community approached the problem of gangs and at-risk youth.” (p 10)
Feedback to Community
It was important to report back to people who shared their thoughts and stories of involvement so I returned to many of the neighbourhood programs. Young people were keen to take the summary booklets and some were excited to see their own photographs featured there. Some youth who had been interviewed wanted the full 140 page version, partly to see if they were quoted there. There was a sense of pride for what they had created and accomplished and some commented on the huge difference the programs made in their lives.
 Continuing the Learning
We know that if fewer adolescents and young adults experienced marginalization due to where they live or the challenges they face, then fewer young people would be attracted to gangs as a solution to their problems or to find a sense of belonging. So, it begs the question…. What should the community take forward from this youth gang prevention project?
We look forward to working with our community to keep learning, but also move the learning to action. The upcoming event “Engaging marginalized youth” will help us do just that and you can join us on Friday April 11, 2014. Registration is required for the event and you can register here. [UPDATE: this event is now SOLD OUT. You can still register but you will be added to the wait list in case of cancelations.]
There’s always more to learn…
Photo Credits: all photos taken by inREACH youth during PhotoVoice projects. 2012