Snapshot on Crime
Posted on: July 23rd, 2013 by Waterloo Region Crime Prevention Council
Over the next ten weeks stay tuned here to the blog discussion on The Root Causes of Crime in Waterloo Region where community leaders, community residents and leading experts across Waterloo Region weigh in on the root causes of crime outlined in the report.
Unemployment Rates & the Relationship to Crime
The relationship between unemployment and property crime is well established in academic literature. Generally a 1% drop in unemployment rates leads to approximately a 1% drop in property crime. The impact on property crime rates is believed to be more pronounced when unemployment is high for male youth. Violent crime and unemployment on their own tend to be unrelated. However, when high levels of unemployment are combined with high levels of alcohol consumption it is believed to cause an increase in the homicide rate.
The Statistics
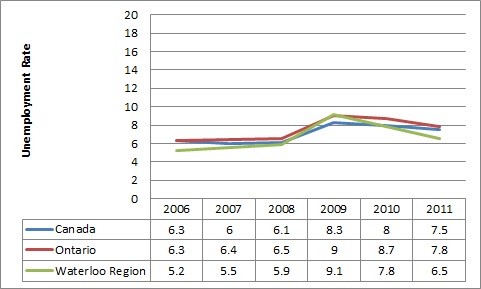
 Source Data: Statistics Canada, Labour Force Survey: CANSIM Table 1095304 (Released Annually)
The Story Behind the Numbers
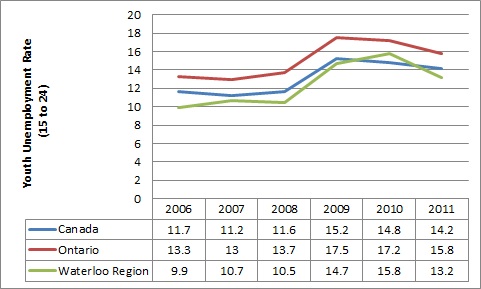
The 2011 decrease in unemployment in the Kitchener-Cambridge-Waterloo CMA echoes a trend that was seen in the rest of Canada.The decrease in unemployment is directly related to a slowly rebounding economy.Youth unemployment improved in 2011 but not to the same degree as unemployment generally.High youth unemployment combined with a growing male population raises some concerns for the local crime rate.
Read the Community Responses
Posted on: July 16th, 2013 by Waterloo Region Crime Prevention Council
Over the next ten weeks stay tuned here to the blog discussion on The Root Causes of Crime in Waterloo Region where community leaders, community residents and leading experts across Waterloo Region weigh in on the root causes of crime outlined in the report.
Children in Care
Children in the child welfare system tend to share histories of significant trauma. Children in the child welfare system are also at higher risk of involvement with the criminal justice system. The number of children in care within Waterloo Region therefore is a measure of the number of children with significant risk factors as well as a measure of risk for future criminal justice system involvement.
The Statistics
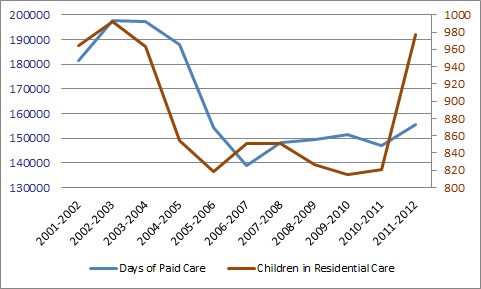 Source Data: Annual Report, Family and Children’s Services of the Waterloo Region, 2012
Story Behind the Numbers
The number of children in Waterloo Region in the residential care of Family and Children’s Service’s of the Waterloo Region increased by 19% from 2011 to 2012, while days of paid care increased by only 5%. This demonstrates a significant increase in children placed in care but only a small increase in days in care. This means most of the increase in children in care were short term stays in care. This one year increase warrants an on-going examination to see if a trend emerges or if it is a temporary impact of economic or other challenges facing the region.
Read the Community Responses
Posted on: July 16th, 2013 by Smart on Crime
According to the 2012 report From One System to Another: Crossover Children in Waterloo Region, “Children living in the care of the child welfare system have a higher likelihood of justice system involvement in comparison to children living with their biological parents” (WRCPC, pg.2). Children who enter out-of-home care often come from disadvantaged families and have been subjected to maltreatment and neglect. The impact of trauma experienced from abuse, neglect, and being removed from their family home can affect a child’s cognitive functioning and may also result in challenging behaviors that jeopardize their development (Reid & Dudding, 2006; Stone, 2007; Trout et al., 2008). As a result youth-in-care are often at higher risk of:
- Involvement in the youth justice system
- Homelessness
- Substance use
- Becoming parents earlier
- Living in poverty
- Using social assistance
- Experience emotional and behavioural difficulties
Four out of ten young people in care have a parent who was a client of the child welfare system as a child. (Leschied et al. London Study, 2003)
Family and Children’s Services of Waterloo Region (FCS) is keenly aware of these research results and is working hard to help improve outcomes for children and youth in care. Admitting a child into care is always a last resort for workers, however when a child is not able to remain safely in their own home, FCS must provide a safe alternative. One of our FCS key service priorities is to ensure that all children have the permanent support of a safe, loving and nurturing family (preferably their own family) in which they can grow and develop towards successful adulthood.
Children in care numbers remained fairly consistent with some modest increases and decreases between the years 2007/08 to 2010/11. However, in the year 2011/12 the agency experienced a significant increase in children in care numbers – 6% over the previous year. As part of a regular review of our service trends, we examined the increase in child admissions to care in 2011/12. Despite the increase, many of these admissions were for short period of time (i.e. five days or less). The increased number of children in care was driven by a number of factors. The economic downturn is felt to have contributed to an increase in referrals and protection applications. The agency also experienced an increase in parents abandoning their children to society care due to lack of resources in the community – particularly resources related to respite services for teens and children with complex developmental/medical needs. In 2011/12 there was also a lack of regional subsidized day care spaces in the community – daycare is often viewed as a protective factor for young vulnerable children who are more visible in the community when they regularly attend daycare.
Agency and Provincial Response to Youth in Care Outcomes
For those children who do require out of home care, Family and Children’s Services works hard to ensure that these children have every opportunity to develop to their full potential. Each child in care has an individual plan developed by the youth, the family, the worker, and key supports in the youth’s life. The plan of care focuses on improving a child/youth’s well-being and resilience. Family and Children’s Services of the Waterloo Region, along with other CAS’s across the province, use The Ontario Looking after Children (OnLAC) model to help improve the outcomes for children placed in out of home care. A key focus of OnLAC is the assessment, documentation and tracking of a child’s developmental progress through an annual assessment (AAR-C2: Flynn, Ghazal, & Legault, 2006).
In addition to planning for individual children, the data gathered through OnLAC is useful at the agency and provincial level to inform service planning on many different levels. Review of data by staff, foster parents and community partners provides assistance with evaluation and future planning and helps raise awareness and increases the attention given to improving outcomes for children in care.
Prevention of Adolescent Admissions
FCS is attempting to work collaboratively with our community partners to reduce adolescent admissions to care. While we recognize the stress that many parents face when dealing with challenging teens, admission to care is rarely the best answer. There are numerous unintended consequences of admitting adolescents to care. Once admitted, youth are;
- Less likely to return home to their family
- Less likely to successfully work through family issues
In addition, having an adolescent youth in care may lead to decreased feelings of competence and confidence for the parents and may lead to decreased feelings of safety and security for youth.
What Can be done by the Community?
- When for whatever reason, parents/caregivers of youth do not feel capable of responding to the youth’s behaviour the caregivers turn to the larger systems to help contain that behaviour
- The larger systems available to them are education, child welfare, youth justice
- Those systems need to be able to come together in a way that helps support the family in responding to the youth’s distress, rather than taking a punitive stance or removing the youth from their (wider) system of support
- It is important for these systems to respond from a trauma and attachment informed lens (i.e look to what is underneath the behaviour, help parents understand the impact of trauma and disrupted attachments in their own lives). This will guide the systems in helping the family to maintain the youth
- Interventions need to be aimed at helping the family to return to a place of emotional and physical safety
Jill Stoddart is the Senior Manager of Innovation, Research and Development at Family and Children’s Services of the Waterloo Region. Jill has a Master’s degree in Social Work from Wilfrid Laurier University and is currently engaged in her Doctoral studies. Jill has spent the last 25 years in the Waterloo Region working with children and families in Developmental Services, Mental Health and Child Welfare.
Posted on: July 11th, 2013 by Waterloo Region Crime Prevention Council
Over the next ten weeks stay tuned here to the blog discussion on The Root Causes of Crime in Waterloo Region where community leaders, community residents and leading experts across Waterloo Region weigh in on the root causes of crime outlined in the report.
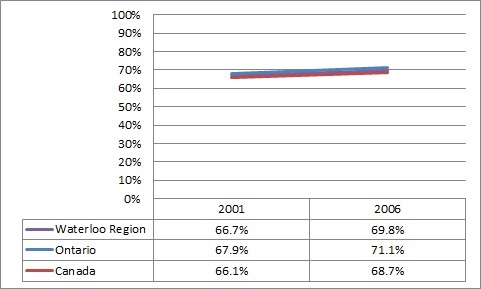
Owner Occupied Homes
Individuals living in owner occupied homes are less transitory than renters. Homeowners’ financial interests also encourage them to support positive neighbourhood interactions. Home ownership also represents a Canadian value because it is seen to alleviate real and/or perceived disadvantages for individuals. For these reasons higher levels of home ownership is a protective factor against crime in a community.
The Statistics
 Source Data: Statistics Canada, Census (Released Every Five Years)
Story Behind the Numbers
Home ownership in the Kitchener-Cambridge-Waterloo CMA increased from 2001 to 2006. This increase in home ownership echoes the national trend which saw a similar increase over this time period. This is a positive trend for Waterloo Region as it indicates increased stability within the population.
Read the Community Responses
Posted on: July 11th, 2013 by Smart on Crime
A couple of years ago, my wife, two teenage daughters and I went to New York City for a few days of sightseeing. New York is a great city and we had a wonderful time visiting places like the Statue of Liberty, Central Park, several museums, and the Empire State Building. We saw Broadway shows and we visited the Blue Note, a famous jazz club from the 1950’s. We wandered around on the sidewalks of midtown Manhattan and Times Square.
There was a time, in the 1970’s and 80’s that the trip would not have been possible. New York was shabby, Times Square was seedy and the whole city was a dirty and dangerous place.
Mayor Rudy Giuliani and Police Commissioner Bill Bratton are credited with cleaning up the city using a program dubbed the “broken windows theory”. The main notion of the broken windows theory is that small crimes can make way for larger crimes. If the “petty” criminals are often overlooked and given space to do what they want, then their level of criminality might escalate from petty crimes to more serious offenses. The mayor and police commissioner rolled out a “zero-tolerance” policy which lead to the rates of both petty and serious crime falling suddenly and significantly, and continuing to drop for the following ten years.
Today, the crime rate is way down, not just in New York City, but in Kitchener-Waterloo too. It has been decreasing steadily for more than a decade. Addressing petty crime and other changes in the way we police might have a lot to do with it.
At the same time, the overall rate of homeownership in Canada is up. It has been increasing since the 1970’s. In 1970, 60.3% of Canadians owned their own homes. In 2006 (the most recent census), 68.9% of Canadians owned their own homes. More notably, is that the rate of homeownership among 20 – 34 year olds is up from 36.1% in 1970 to 46% in 2006.
Is there a co-relationship between home ownership and crime? Is crime down because homeownership is up?
I think so.
By the time most people reach their mid to late 20’s, most everyone wants to settle down, get married and start family. With that, usually comes buying a first home. Homeownership contributes to a vibrant, dynamic, and healthy community. Homeownership is the foundation for stable and safe neighbourhoods.
If people see litter they are more likely to litter.
Similar to Mayor Giuliani’s broken window theory, the pride of homeownership has an intangible benefit that encourages homeowners to take care of their properties. Neighbourhoods with higher rates of homeownership are more stable, better maintained and most importantly safer.
Furthermore, neighbours influence each other. When one neighbour maintains his home by doing some landscaping or outside improvements, other neighbours follow suit. Homeowners, by nature, care about their homes and their neighbourhoods. Vibrant communities are formed through strong neighbourhoods.
As a real estate agent, I know the various neighbourhoods in Kitchener-Waterloo. There are some great neighbourhoods and there are some where I would dissuade a client from buying a home.
Neighbourhoods reveal themselves through their traffic patterns, crime rates, school rankings, ambiance, noise and smell, walkability, shops, parks, amenities, and general upkeep. These factors, of course are interrelated. You can learn a lot about neighbourhoods simply by spending some time in them. I advise my clients to do this and to take notice of the curb appeal of the houses, the speed of the traffic, the friendliness of the people, the noise and smell, whether the recycle boxes have been brought in a day after garbage day, if there are any shopping carts or abandoned furniture on the boulevard… It’s not rocket science. It’s common sense. I also advise my clients to check out the school rankings, the police incidence reports and in some cases the city planning department. Neighbourhoods are not equal. Choosing a good neighbourhood is more important than finding a great house.
All in all, we are trending well in Kitchener-Waterloo. Crime is down. Home ownership is up. Neighbourhoods that were considered unsafe and decaying fifteen years ago are transforming into sought after and vibrant places to live. There is a trend, not only in Kitchener-Waterloo, but across North America, for urban living – people are moving back into the core. New York City’s transformation was quick and well publicized. Kitchener-Waterloo’s transformation has happened and is continuing to happen right before our eyes.
Data Sources:
Statistics Canada, Canada Yearbook 2011. Families, households and housing.
Statistics Canada, Canada Yearbook 2011. Home ownership rates by age group, all household.
Broken Windows Theory
Author: Keith helps homebuyers understand homes, schools and neighbourhoods in Kitchener-Waterloo. He is an author, an award-winning realtor and an agent of change. On Twitter @kdmarshall. Online at keithmarshall.ca and 365-kw.com.
Posted on: June 28th, 2013 by Waterloo Region Crime Prevention Council
The data in the section of Root Causes of Crime in Waterloo Region titled Income of Low Income Families is no surprise to those of us who are familiar with poverty-related issues in our regional community. In fact, in Waterloo Region, 36 earners make more than $2.57M; 360 make more than $685K; 3,610 (the top 1%) make more than $396K. Individuals who make more than $81,200 are in the top 10%. On the other hand, the median income of the bottom 50% is $14,100!* In 2007, one third of employed individuals were earning $14.00/hour or less. This is poor – it may not be deep (or absolute) poverty, but it is precariously close to it.
Another point I’d like to make has to do with the title: ‘Income for Low Income Families’. I’m concerned that when we (government, media and community groups) use only the word ‘family’ or ‘children’ in our communications about poverty, we further stigmatize the ‘individual’. By leaving out the word ‘individual’ are we not practicing a type of exclusion even as we talk about and promote inclusion? Now, I know that the use of the word ‘individual’ in conjunction with poverty has greater stigma attached to it than the word ‘family’ or ‘children’ and most likely this is why many of us omit the ‘i’ word. But is this REALLY okay with you?
This brings me to the issue that is – in my opinion – the root of all root causes and needs the highest priority in order to significantly reduce and prevent poverty in the long term – this is the stigmatization of people living in poverty. Societal attitudes/values impact our political voting choices and influence policy decisions. It’s my belief that if enough of us TRULY believed that everyone was a valuable member of society, we’d have much better policies in place reflecting that belief.
Since 2007, as resources allow, Opportunities Waterloo Region has been working on an initiative to shift societal attitudes towards people living in poverty. As a result of the early work completed by partners from across Canada, a three-phase strategy was developed. The three steps are:
-
research deep-seated attitudes of Canadians towards people living in poverty,
-
research best practices, and
-
develop a comprehensive, long-term multi-faceted approach to shift these attitudes.
The research step is critical. We think we know what the attitudes are, but these might be ones that are only visible on the surface. We need to know what the deep-seated societal attitudes are and how (or if) they connect to one another, so that we can create an effective communications strategy. Lofty goal? Big job? You bet!
This project stalled because we could not find the research dollars to begin the first step. Then in 2011, as a result of Opportunities Waterloo Region’s long-term partnership with Dr. Terry Mitchell, Associate Professor, Psychology at Wilfrid Laurier University, we were able to begin a project to research deep-seated societal attitudes towards people living in poverty. Some of the data collected over the two years was analyzed, the results of which was presented at the May 28th Community Conversations Series event. You can view the presentation here. The findings were discussed and ideas for next steps considered. A fact sheet is currently being developed and will be share in our September newsletter.
If you’d like a copy of the fact sheet or further information about the research project, please let me know. Although we don’t have all the answers yet, progress has been made, various strategies to shift attitudes are being discussed, and we are having deeper conversations about these attitudes – all very important early steps.
The research will continue in 2013-2014. Stay tuned for updates as they develop by reading about this project on our website.
*Data analysis by Ernie Ginsler using Statistics Canada Data, 2010.
Author: Since 2004, Mary MacKeigan has been the Executive Director of Opportunities Waterloo Region, a non-profit organization dedicated to the prevention and reduction of poverty. She has more than 20 years of experience in the field of poverty prevention, reduction and alleviation.
Posted on: June 27th, 2013 by Waterloo Region Crime Prevention Council
Over the next ten weeks stay tuned here to the blog discussion on The Root Causes of Crime in Waterloo Region where community leaders, community residents and leading experts across Waterloo Region weigh in on the root causes of crime outlined in the report.
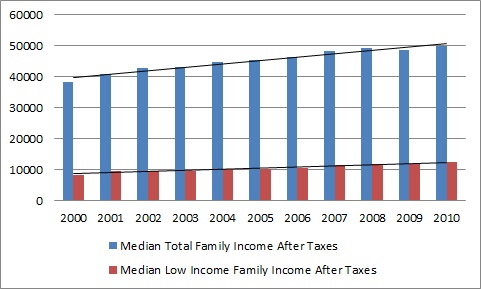
Income of Low Income Families
Neighbourhoods that are at an economic disadvantage when compared to other areas report higher crime rates. In addition, societies where wealth is concentrated amongst a small group of individuals report higher crime rates. The graph below shows the average income of individuals in the Kitchener-Cambridge-Waterloo CMA and compares it to the average income of low income individuals in this area. This chart tracks the gap between low income individuals and those with significantly better economic means.
 Source Date: Statistics Canada, CANSIM Table 111-0015 (Released Annually)
The Statistics
The gap between low income families and the middle income families is growing in the Kitchener-Cambridge-Waterloo CMA. This gap is largely the by-product of stagnant incomes for low income individuals. This growth disparity in the distribution of income suggests low income families in Waterloo Region are not benefiting equally from economic growth.
Read the Community Responses
Posted on: June 25th, 2013 by Waterloo Region Crime Prevention Council
Our Waterloo Region community has a lot to say about most any topic you can think of, but, we are particularly passionate when it comes to talking about making change for a healthier and stronger community. We’re pretty good at moving to action too, not just talking about it!
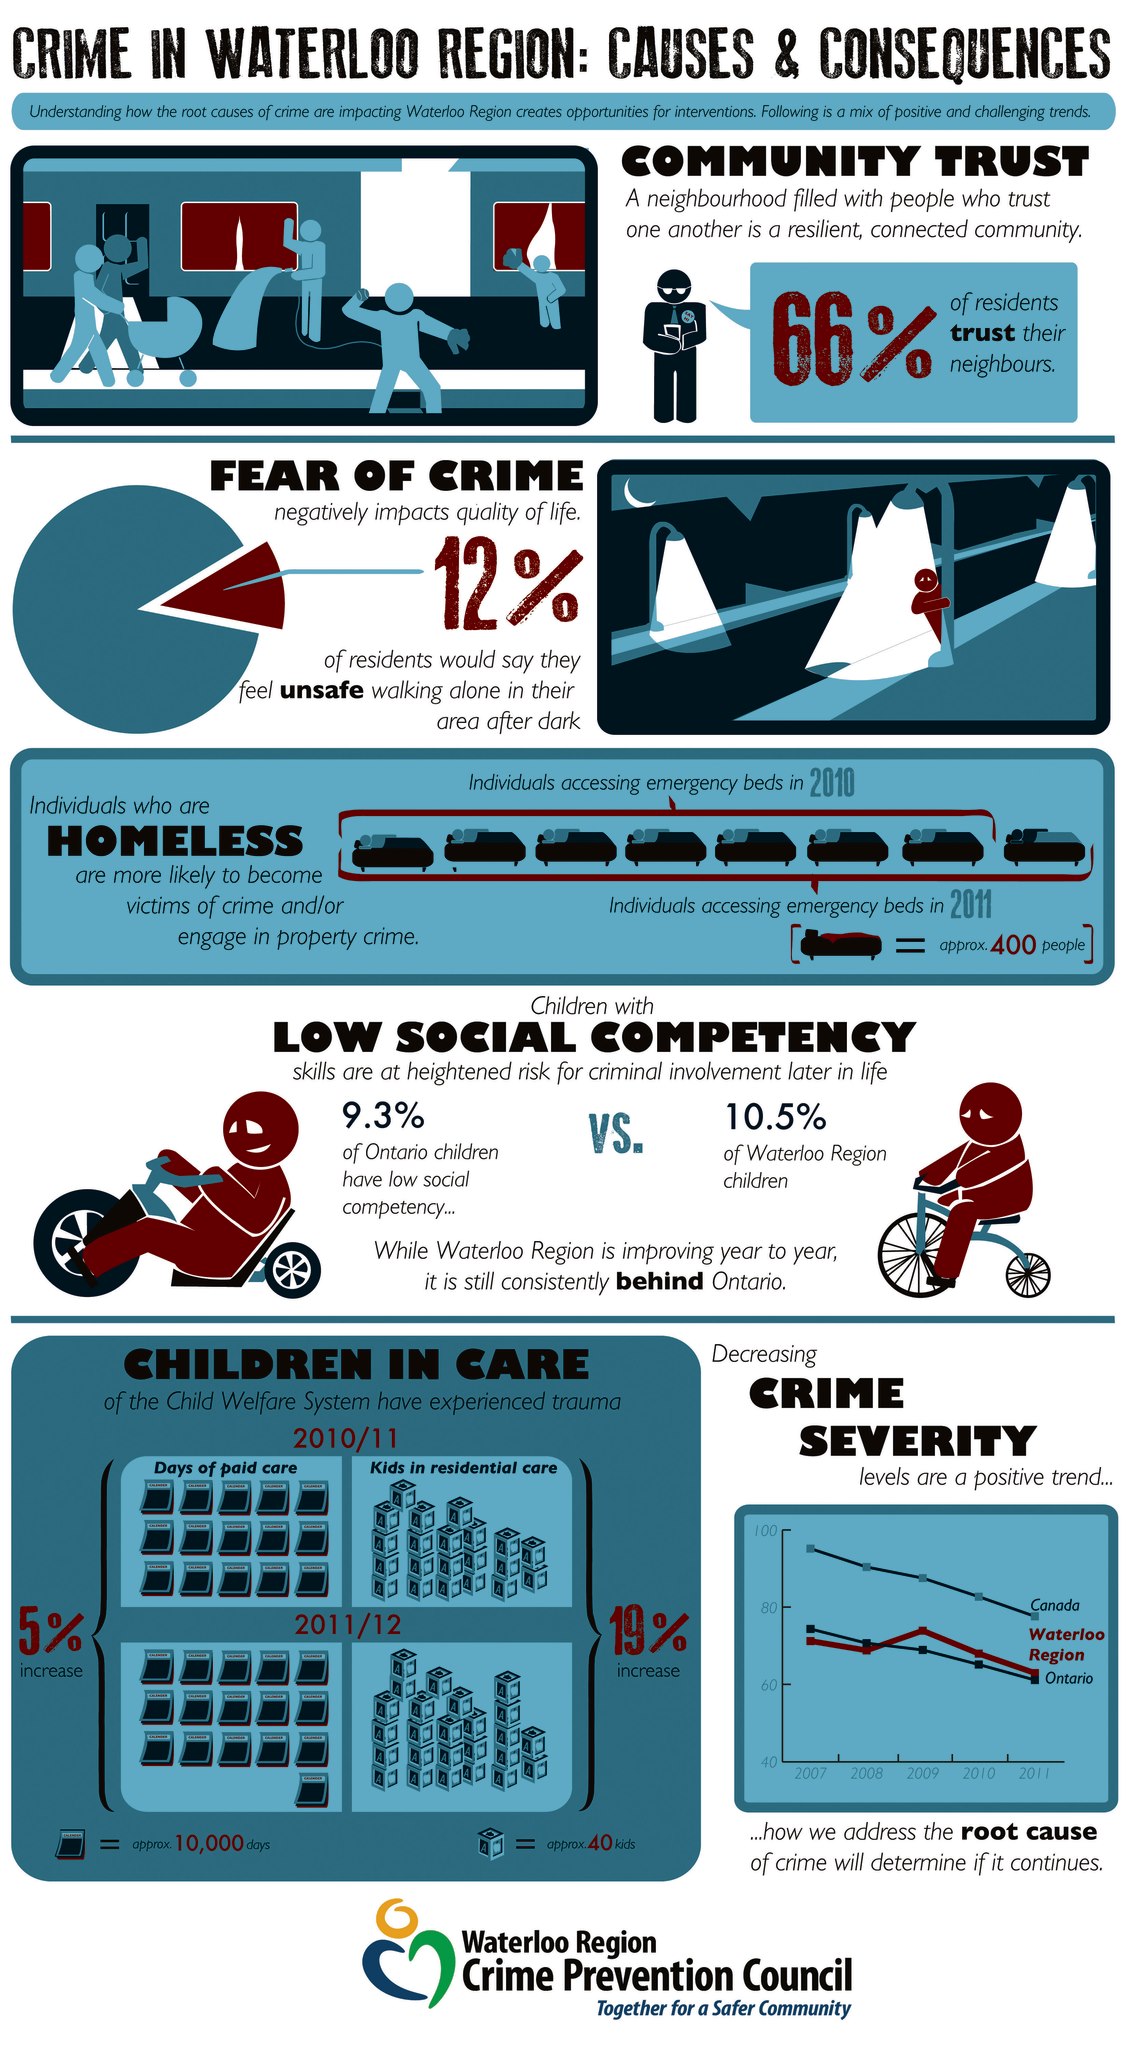
The Waterloo Region Crime Prevention Council believes monitoring the root causes of crime can aid the community in addressing crime, victimization and fear of crime through awareness, discussion, leadership and action. Once the root causes are understood more clearly, resources can be applied to areas where the community is doing poorly. A Snapshot in Time: The Root Causes of Crime in Waterloo Region identifies the root causes of crime right here in Waterloo Region and provides a tool to aid local policy makers in targeting interventions to where they are most needed and where they can have the greatest impact.
In addition to being a monitoring tool the Waterloo Region Crime Prevention Council is using this report to aid members of the public in comprehending the complex connection between social and economic circumstances and crime. The report was written in a straightforward manner with each of the root causes containing an explanation of why it was included, a graph showing the statistics for Waterloo Region and a short story giving details on what is going on behind the numbers. Additionally, Wade McAdam created the following information graphic to help tell the story of the root causes in an easily accessible format.
A Snapshot in Time is also designed to be a catalyst for conversations in Waterloo Region about the root causes of crime. Over the next ten weeks tune in to this discussion through our blog series where community leaders, community residents and leading experts across Waterloo Region weigh in on the root causes of crime outlined in the report. Numbers only tell part of the story. It’s the human stories and context that make them come alive, create insight and move us to action.
I hope you will join us. We’re standing by… waiting to hear what you have to say!