Posted on: January 16th, 2017 by Waterloo Region Crime Prevention Council
Homicide rates rose in 2015 in Canada, Ontario, and Kitchener-Cambridge-Waterloo census metropolitan area (CMA).[1] It will remain to be seen over the next few years whether this represents a notable change or simply reflhttp://ftn#1ects year-to-year variations in rates. Nonetheless, homicide rates in both Ontario and the Kitchener-Cambridge-Waterloo CMA continue to be below the national average, and Canada’s homicide rate has been dropping overall since 1975. What we do see is that homicide continues to impact some groups more than others, including Aboriginals, males, and those living in the Prairie Provinces.
The homicide rate in Canada rose in 2015 by 15%, reaching its highest levels since 2011. In 2014, there were 521 homicides, while in 2015, there were 604, increasing the homicide rate per 100,000 Canadians from 1.47 to 1.68.[2], which is still 2% lower than the average rate for the ten-year period between 2005 and 2014.[3]
Ontario also saw an increase in the homicide rate from 1.14 to 1.26. The Kitchener-Cambridge-Waterloo CMA also saw an increase in homicides from 3 to 6, with a corresponding increase in the homicide rate from 0.56 to 1.11, but these numbers are more variable because of the lower number of homicides.
2015 saw increases in homicide both involving firearms and involving gang violence. In Canada in 2014, 155 homicides were committed with a firearm, compared to 178 in 2015, an increase of 15%, and the highest number since 2008. Gang-related homicides also increased from 82 in 2014 to 98 in 2015, an increase of 20%, and the highest number of gang-related homicides since 2011.
The number of homicides increased primarily in three provinces: Ontario, which had 18 more homicides for a local increase of 23%; Alberta, which had 27 more homicides for a local increase of 25%; and Saskatchewan, which had 19 more homicides for an increase of 79%.
However, not all changes in homicide rates were increases.
Homicides by strangers dropped by 21% from 73 to 58 between 2014 and 2015. Conversely, 87% of victims knew those accused of their homicides.
Intimate-partner homicides remained relatively stable, with 83 such homicides in 2015 compared with 80 such homicides in 2014.
Continuing Patterns
Homicide continues to affect certain portions of the population and certain parts of Canada more than others.
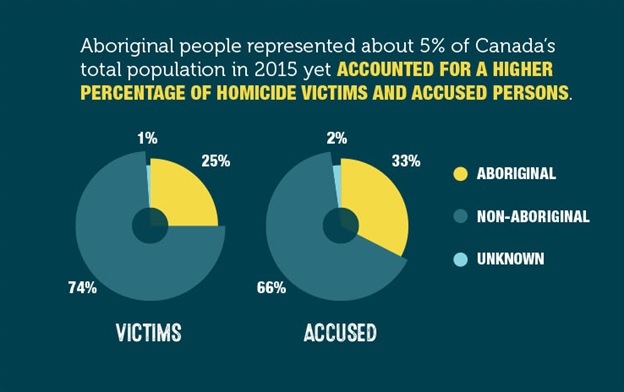
Homicide continues to disproportionately involve Aboriginal Canadians, with 25% of homicide victims and 33% of those accused of homicide being Aboriginal, though Aboriginals make up only 5% of the population.
Males continue to be over-represented when it comes to homicide, accounting for 71% of homicide victims and 88% of those accused of homicide.
Homicide continues to be overly prominent in the Prairie Provinces, for all of which homicide rates are now over 3 per 100,000, with Saskatchewan’s and Manitoba’s rates being more than double the national average.
Putting It All Together
Homicide provides a significant cost to Canadian society. According to a research report by Public Safety Canada, each homicide costs Canadians between $4.8 and $5.9 million.[4] These costs, along with the human costs of homicide, provide important incentives for monitoring and reducing the number of homicides in Canada.
Though homicide rates increased between 2014, it is difficult to say what this means. There have been similar spikes before, such as in 2011, when the rate spiked by 8% only to drop by over 10% the next year. Ontario witnessed a similar spike and drop between 2005 and 2006. In regard to the Kitchener-Cambridge-Waterloo CMA, because there are so few homicides, the homicide rate is likely to vary from year to year, with 8 homicides in 2013, then 3 in 2014 and 6 in 2015. It would take several years of higher rates before any continuing pattern could be identified. Nonetheless, the homicide rate in Ontario of 1.26 per 100,000 remains below the national average of 1.68, as does the homicide rate in the Kitchener-Cambridge-Waterloo CMA at 1.11 per 100,000. Overall, homicide has been on a decline since a national high of 3.02 in 1975. What we do see is that homicide continues to impact some groups and areas more than others, including Aboriginals, men, and the Prairie Provinces.
[1] The Kitchener-Cambridge-Waterloo census metropolitan is the Region of Waterloo excluding the Township of Wellesley and the Township of Wilmot
Author: Daniel is an MSW student with the Waterloo Region Crime Prevention Council working on various research projects and community engagement initiatives. Daniel holds a doctorate in philosophy from the University of Toronto, where he taught for six years. He now runs a mediation and psychotherapy practice in downtown Kitchener while completing a master of social work degree at Wilfrid Laurier University.
Despite homicide being a rare event in Canada, when it happens, it is the highlight of media headlines. Television news, newspapers, and social media sources all follow the story closely. In parallel to media coverage, there is a steady growth of stories being told about crime. These are found in popular novels writing about true crimes and television dramas sensationalizing the role of police and courts. With all of this attention on crime, it might be fair to imagine that consumers’ craving for violent crime related publications and or news drives its unproportioned publicity and its media focus, however, it is much more complicated to figure out which one comes first.
Homicides attract a great deal of media attention but it’s important to remember that they make up less than 1% of all violent crimes. Although homicide rates decreased last year, the homicides that did occur were heavily reported. The media focus on violent crimes, like homicide, has a great effect on the perceptions of ordinary citizens that leads to inaccurate beliefs that crime has increased. This influence of media on perceptions of crime is evident among the citizens of Waterloo Region. For instance, in the report, Won’t you be My Neighbour, the WRCPC used survey data from 2012 to show that 61% of the respondents think there is more crime Waterloo region today than when they were a child. In addition one-third of Waterloo Region residents think crime has increased over the past five years. This is despite the crime rate having dropped dramatically over the past 25 years in Canada and Waterloo Region. When news media use inflammatory language for front page headlines this can incite fear among readers and viewers and have a profound influence on the public’s perception of violent crimes including homicide.
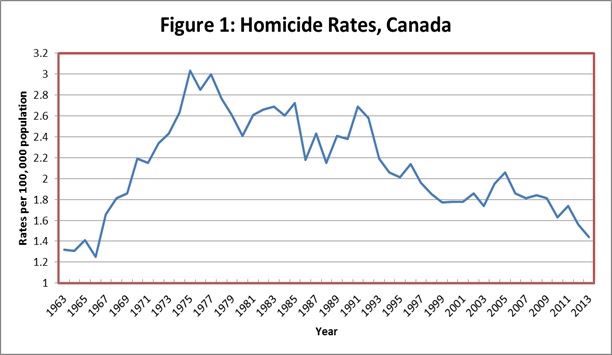
The rate of homicide in Canada has been in steady decline since the 1980s. In 2013, there were 505 homicides in Canada, 38 homicides fewer than the previous year, marking an 8% decrease in the homicide rate (1.44 per 100,000 population). The homicide rate has generally been decreasing since peaking in the mid-1970s. (see Figure 1- homicide rates 1963 to 2013)
Source(s): Data on homicide are available back to 1961 in CANSIM table 253-0001.
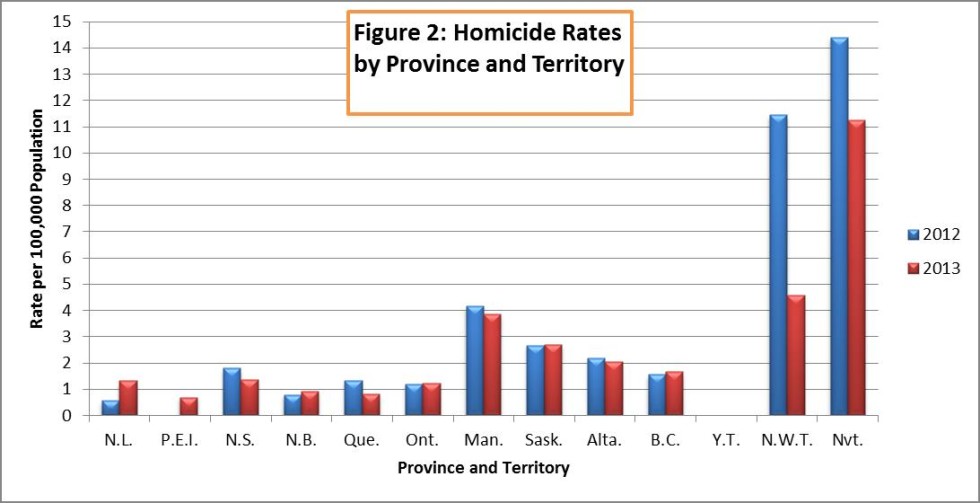
Homicide, police-reported homicide rates, by province and territory, 2012 and 2013
Among the provinces of Canada, British Colombia, Ontario and Newfoundland and Labrador, saw a marginal increase in homicide numbers in 2013. On the other hand, Quebec saw 40 less homicides in 2013 than in 2012. Yukon was the only jurisdiction to report no homicides (See Figure 2). Overall, the number of homicides in Canada continued to decline as of 2013 across most provinces and territories and most census metropolitan areas.
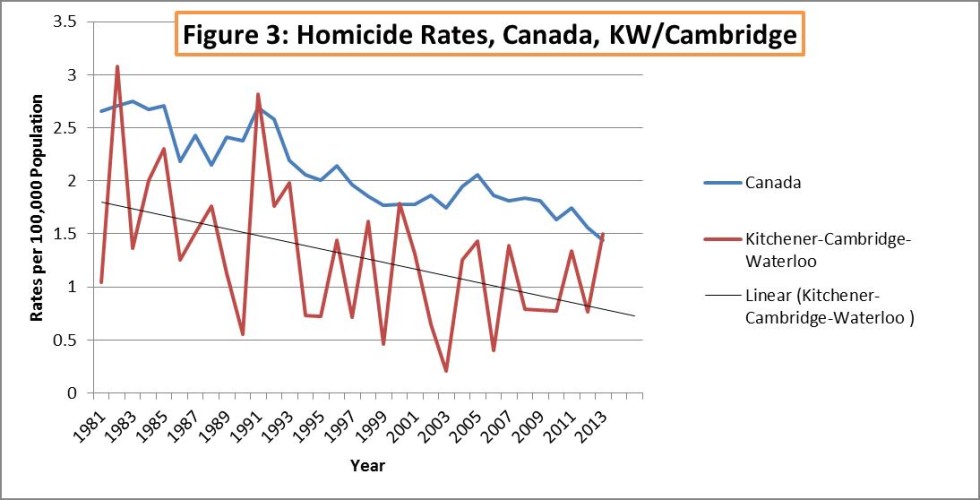
Against this backdrop, crime in Waterloo Region in 2013 showed a one year blip where our homicide rate rose above the Canadian average. From 1981 to 2013 there were 171 homicides in the Kitchener-Cambridge-Waterloo CMA; that’s an average of 5 per year. Looking just at one year snap shots though we see the number rise to as high as 11 and drop to as low as one. A wide fluctuation like this does not mean we should panic if the rate shows a one year blip, nor should we dismiss homicides as a possibility in times when the rate drops. What’s import to examine is the trend over time, which is declining in Waterloo Region just like it is declining in Canada (Figure 3).
Homicide, police-reported rates, Canada, Kitchener/Waterloo/Cambridge – 1981 to 2013
Source: Statistics Canada, Homicide Survey, Canadian Centre for Justice Statistics.
As shown above, the rate of homicides in Waterloo Region rose above the national average in 1982, 1991, 2000, and 2013. Although the increases of the homicide rate in these four years seems alarming, in every other year, stretching 32 years of homicide rate, it was consistently lower than the national average. Waterloo Region is a safe place to live with relatively few homicides. On the other hand, although the Region has a low homicide rate, one major incident can affect the statistical rates and the publication of the event with sensational headlines could incite fear among readers and viewers and potentially trigger unfounded perceptions of crime being on the rise in our community.
What do you think is a good measure of safety in our community?
A criminal offence against a person or property is considered a hate crime when there is evidence that the offence was motivated by hate, based on the victim’s: race, ethnic origin, language, colour, religion, sex, age, mental or physical disability, sexual orientation, or other similar factors. In 2009, in Waterloo Region, Police identified 93 crimes that fit this definition. While the number doesn’t tell us the nature of these reported hate crimes, these 93 situations represent the number of crimes that came to the attention of police that were classified as hate crimes in 2009.
But before we jump to conclusions about Waterloo Region being a hot bed of hate and discrimination, we might want to take a look at other cities and regions. St. John’s, Saint John, Barrie and Thunder Bay reported zero hate crimes incidents in 2009 and Saguenay, Trois-Rivieres and Greater Sudbury reported one hate crime incident each. When it comes to any urban centre, we can be reasonably confident that zero or one hate crime per year might have more to say about what comes to the attention of police and how it is classified than reality.
What we might conclude from the Census Metropolitan report in 2009 is that the reporting approaches are at this time too diverse to portray an accurate cross city picture. Comparisons between jurisdictions require similar reporting standards and such consistency did not exist in 2009. Thus, higher numbers might point to a more rigorous reporting and/or greater community attention to an issue.
But the report is not fully useless by any stretch of the imagination. What we can and should do is use the data to compare hate crime rates over time. Such comparison works on the assumption that Waterloo Regional Police Service are more or less consistent in how they define and report hate crimes from year to year. On that basis Waterloo Region saw a steady decline in hate crimes from 93 in 2009, to 55 in 2010, to 41 in 2011 and 30 in 2012. That is a promising emerging trend. There is a BUT…
One hate crime is simply one hate crime too many. Crime prevention and the creation of a peaceful (read “inclusive”) society are intimately linked. And there can be no peace without inclusion. Understanding the nature of hate crimes in Waterloo Region should be a critical next step in our shared goal of creating a community that is safe for everyone. Armed with information about who the victims of hate crimes are, who has committed the offences, and what trends we observe overall provides us with data that can help us to begin to prevent these crimes.
In 2012, the KW Multicultural Centre, along with numerous community partners developed a series of workshops designed to help community members better understand hate crimes, learn how to recognize potential hate crimes, how to help victims and what to do in the event of witnessing an incident that might be a hate crime. The workshop materials were designed in a way that those who completed it could deliver the workshop to other groups. To date, more than 15 workshops have been conducted in our community with over 250 people taking the training. These and other efforts help to raise awareness about the importance of hate crime prevention.
In an effort to do our part and continue the dialogue and problem solving, the Waterloo Region Crime Prevention Council recently released a RAP Sheet on Hate Crimes. The RAP sheet contains a number of suggestions on “what you can do” to address and prevent hate crimes. We are also committed to continuing to watch the data and educate ourselves by speaking to those who have lived experiences. Watch this page and our website for information we gather and for what we are learning. Also watch for how you can stay or get involved.
Meanwhile, we are keen to learn what you think! We are especially keen to learn what ideas you have to prevent hate crime before it happens.
Author: Anthony Piscitelli is Supervisor, Planning & Research with the Waterloo Region Crime Prevention Council. He collaborates on all research efforts published by WRCPC.
The police-reported Crime Severity Index (CSI), which measures the volume and severity of crime, declined 9% in 2013 compared with 2012. This was the 10th consecutive decline in the index. The CSI was 36% lower than 10 years earlier.
The traditional crime rate also declined in 2013 compared with 2012, falling 8%. It continued its long-term downward trend that began in the early 1990s, reaching its lowest level since 1969. Since 1962, the traditional crime rate has measured the volume of crime, but does not take into account the severity of crimes.
Canadian police services reported just over 1.8 million criminal incidents (Criminal Code offences excluding traffic) in 2013, down approximately 132,000 from the previous year.
Most offences were down in 2013. The decline in the CSI was specifically attributable to declines in breaking and entering and robbery. Decreases in some of the less serious but very frequent offences, such as theft of $5,000 or under and mischief, also contributed to the drop in the CSI.
However, some offences were up in 2013. In particular, police services reported more incidents of extortion, child pornography, aggravated sexual assault (level 3), sexual violations against children and identity fraud.
Crime Severity Index down in most provinces and territories
In 2013, most provinces and territories recorded a decrease in their CSI compared with 2012. However, the CSI increased in Yukon (+6%) and Newfoundland and Labrador (+1%).
Prince Edward Island, New Brunswick, Quebec and Manitoba (-12% each) recorded the largest declines among the provinces and territories.
In most provinces, the decline in the CSI was largely due to fewer breaking and entering incidents. However, in British Columbia, robberies were behind the decline in the CSI. In the Northwest Territories, a decrease in homicides resulted in the drop in the CSI, whereas the decline in Nunavut was due to a large decrease in incidents of mischief.
As in previous years, each territory had a higher CSI than any province. Saskatchewan had the highest CSI among the provinces, while Ontario had the lowest.
Crime Severity Index down in almost all census metropolitan areas
For the first time since 1998, the first year for which the CSI was calculated, none of Canada’s census metropolitan areas (CMAs) recorded an increase in its CSI. The CSI was unchanged in Edmonton, while it declined in all other CMAs. The largest decrease compared with 2012 was in Victoria (-17%).
Despite a 7% drop in its CSI, Regina had the highest CSI of any CMA, while Barrie and Guelph had the lowest.
Violent Crime Severity Index continues to decline
The violent CSI fell 10% in 2013 compared with 2012, marking the seventh consecutive decrease.
Canadian police services reported approximately 384,000 violent incidents in 2013, down about 32,000 from the previous year. The decline in the violent CSI was mainly due to a decrease in robberies and, to a lesser extent, fewer assaults with a weapon or causing bodily harm (level 2), common assaults (level 1) and uttering threats.
Police reported 505 homicides in 2013, down 38 from 2012. The homicide rate was 1.44 victims per 100,000 population, the lowest rate since 1966. Police also reported 642 attempted murders in 2013, down 23 from the previous year.
Every province and territory except Newfoundland and Labrador saw a decrease in their violent CSI compared with 2012. Similarly, every CMA saw their violent CSI decline except Trois-Rivières, St. John’s, Brantford and Calgary, which recorded increases.
Increase in police-reported “sexual violations against children”
In 2013, the police reported 4,232 incidents in the “sexual violations against children” category, 279 more than in 2012. This was one of the only violent crime categories to increase in 2013.
The “sexual violations against children” category includes five specific offences under the Criminal Code: luring a child via a computer, sexual exploitation, sexual interference, invitation to sexual touching and making sexually explicit material available to a child. However, this category excludes sexual assaults against children, which are classified with all other sexual assaults, including those against adults.
Of the sexual violations against children, luring a child via a computer showed the greatest increase, rising 30% in 2013, followed by sexual exploitation (+11%). In contrast, invitation to sexual touching decreased 5%.
Non-violent Crime Severity Index is down
Most crimes reported by the police are non-violent. Police reported just over 1.4 million non-violent incidents in 2013, or nearly four crimes in five, of which 1.1 million were property crimes. The non-violent CSI decreased 8% compared with 2012, the 10th consecutive decrease in this index. The non-violent CSI was 40% lower than a decade earlier.
While most non-violent offences declined in 2013, the decrease in the non-violent CSI was mainly due to a large drop in the number of incidents of breaking and entering, theft of $5,000 or under and mischief. However, some offences in the non-violent category rose in 2013, specifically counterfeiting, child pornography and identity fraud.
Almost every province and territory saw their non-violent CSI decline in 2013. The largest decreases were in New Brunswick and Prince Edward Island, while the non-violent CSI was stable in Newfoundland and Labrador and increased in Yukon.
Most CMAs also saw a decrease in their non-violent CSI except Edmonton, where the index rose in 2013 as a result of more motor vehicle thefts and theft of $5,000 or under.
Youth Crime Severity Index down for the fourth consecutive year
The youth CSI fell by 16% in 2013 compared with 2012, the fourth consecutive decline. The youth CSI measures the volume and severity of crimes for which an accused aged 12 to 17 was identified.
The decline in the youth CSI was mainly due to fewer youths accused of robbery, breaking and entering or theft of $5,000 or under.
Every province and territory except Yukon saw their youth CSI decline compared with 2012. Among the provinces, Saskatchewan recorded the highest youth CSI, while British Columbia, Ontario and Quebec had the lowest.
With the release of the Statistics Canada report also comes analysis and critique of the statistics. Here’s a few that we read:
Posted on: January 21st, 2014 by Waterloo Region Crime Prevention Council
Public opinion polls have been asking Canadians questions about crime policy, perceptions of crime, and attitudes towards the criminal justice system for over forty years. During this time over 700 questions about crime have been asked by Gallup, Pollara, Ipsos Reid, Statistics Canada’s General Social Survey, the Canadian Election Study and Environics Institute. LISPOP associate Dr. Steve Brown and I have assembled these questions in an archive and are using them to track changes in the public’s views about criminal justice matters over the past few decades.
For more on how public opinion towards crime in Canada has changed over time, please visit lispop.ca. Here, I will focus on how shifts in public opinion towards crime can influence policy.
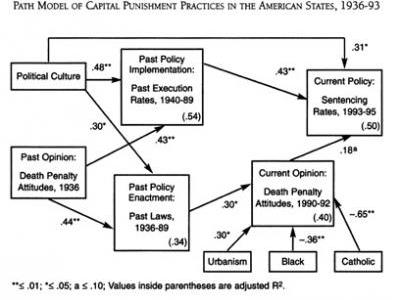
The relationship between public opinion and policy is complex. In 2000, Barbara Norrander published a study examining capital punishment practices in the United States. Her research shows current death penalty policy in a state is shaped by past policy, political culture and current public opinion. Current opinion is also influenced by past policy and socio economic background. But since past policy is shaped by past opinion there is an indirect effect, where past opinion helps to shape current opinion by changing past policy. Confused yet? Despite the complicated explanation and diagram, below, it’s actually fairly straightforward; past opinion and past policy are constantly influencing one another shaping both current policy and current opinion. Okay, maybe it’s not simple, but it certainly is elegant.
Norrander, 2000 The Multi-Layered Impact of Public Opinion on Capital Punishment Implementation in the United States
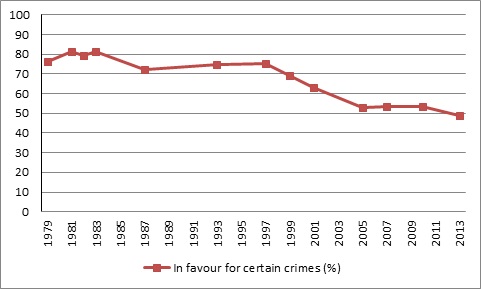
This model provides a useful explanation for attitudes towards capital punishment in Canada. Support for capital punishment has been steadily falling since the 1980s. Over 80% of respondents supported capital punishment in the early 1980s, since this time support has fallen significantly. Today when respondents are asked if they support capital punishment for certain crimes support is below 55%.
Support for Capital Punishment
This drop in support can be explained, at least partially, by the abolishment of the death penalty in Canada on July 14th, 1976 (the last execution in Canada took place on December 11th, 1962). Any Canadian, who grew up after this time, grew up in a Canada without the death penalty. So a policy decision, which at the time went against public opinion, helped to shape future public opinion by normalizing a Canada without the death penalty.
Public opinion does not always work this way. Often public opinion will react in the opposite direction of policy decisions. James Stimson a researcher in the United States wrote two books, Tides of Consent and Public Opinion in America, which examine the public mood and compares it to policy decisions. What he found is that public opinion often runs in the opposite direction of the party in power. So if Democrats are in power the people start to say we need more conservative policies and if a Republicans are in power the people start to say we need more liberal policies. Stimson explains that this occurs because of policy excess. A newly elected government starts to implement policies that the public wants, but over time as they continue to create more policies the public starts to say, you’ve gone too far, we need to scale back.
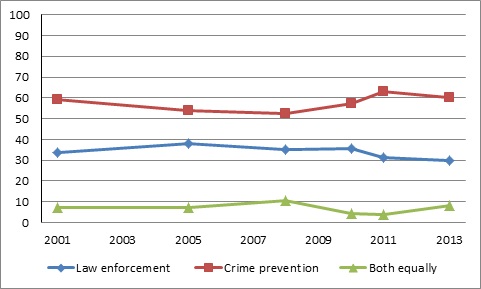
This effect can be seen in Canada. Environics Institute [http://www.environicsinstitute.org/] regularly asks how Canadians would like to see crime addressed, through an emphasis on law enforcement or a focus on crime prevention. Since 2005 there has been a noticeable increase in the number of respondents saying they prefer crime prevention approaches and a decrease in respondents who prefer law enforcement approaches.
Crime Prevention vs. Law Enforcement
Since 2006 the Canadian government has focused on being tough on crime. The policy approach continues to this day but it seems the Canadian public is starting to see these changes as a policy excess. Instead of focusing on punishment, public opinion polls suggest the government focus should be on prevention through education and social development programs.
What do you think? How would you like to see crime addressed in Canada? Do you think we need changes to crime legislation? Would you like to see additional investments in social development programs?
Norrander, B. (2000). The multi-layered impact of public opinion on capital punishment implementation in the United States. Political Research Quarterly, 53(4).
Posted on: September 4th, 2013 by Waterloo Region Crime Prevention Council
Crime prevention, social capital, neighbourhood cohesion… all the stuff of Jane Jacobs and Mr. Rogers! In this latest episode of “By The Numbers” Anthony Piscitelli pays homage to a certain friendly neighbour in order to give you the highlights of a recent report from the Waterloo Region Crime Prevention Council.
What do you think…. does your neighbourhood have a high level of social capital? Or do you live in a neighbourhood that has a high fear of crime? What does your neighbourhood do to build community and social capital?
Do politicians and a debate about policy and policy changes impact public opinion? Anthony Piscitelli asked this question at the end of the previous episode and now he reveals his answer!
Indeed, policy changes made at the political level appear to have some influence on public opinion and attitudes toward crime and the criminal justice system. Politicians have a role in leading public opinion but they also have a role in following it. When politicians float a ‘trial balloon’ policy, it is often in an attempt to test the waters of public opinion of a particular issue. Remember Bill C-30? The ‘cyber surveillance’ bill was tabled early in 2012 but was quickly pulled off the table due to a huge public outcry and several social media campaigns. It has yet to reappear….
The main message of these ‘By the Numbers’ videos is still this: the relationship between public opinion, policy and political decision makers is complex – more than complicated! Know that your opinion matters, listen carefully about issues that matter to you… and learn to read between the lines – or, the numbers.
Thanks for watching! Do you have any ‘by the numbers’ worthy topics you are curious about? If you have something you would like to see covered in an episode of ‘By the Numbers’, leave a comment below or contact us info [at] smartoncrime.ca.
A huge thank you to the staff & team at Gibson Sound & Vision, Waterloo for accommodating us at their store to record this video!
Everyone wants to know… how do political leaders make their decisions about crime policy anyway? Are they influenced by public opinion polls? Do politicians influence public attitudes?
In the first episode of this By The Numbers series, Anthony Piscitelli guided us through 40 years of historical data on public attitudes toward the criminal justice system. In general, the evidence showed some interesting trends:
more people are gravitating towards crime prevention rather than law enforcement as a means for preventing crime,
more people thinking that crime is falling,
less support for harsher sentences,
more support for the justice system
dramatic drops in support for capital punishment
But the trends are not the whole picture. In this episode, Anthony brings up some other factors that influence public opinions and the possible relationship between public attitudes and how crime policy is formed. It’s complicated… to say the least!!
So, what do you think? Is this overly complicated? Is there a connection between public attitudes and crime policy? Does a debate about crime policy influence pubic opinions? Looking forward to hearing what you have to say!
You probably already know this about the Waterloo Region Crime Prevention Council, but it bears repeating…. When a wicked question1 comes our way, we’re not satisfied until we get an answer, even if it means tons of research and pounds of data!
Our wicked question began to take shape with the introduction of the Safe Streets and Communities Act in Canada (Bill C-10). This omnibus crime legislation was ushered in with a ‘tough on crime’ message that seemed to resonate with some of the voting public and certainly elicited an emotional reaction. True to our investigative nature here at the WRCPC, it got us thinking… and a wicked question was born. We wanted to know, “Does the tough on crime message work?” And if so, for what purpose? We were also curious to know, “Is there another message that captures prevention, addressing root cause issues and being ‘smart on crime that would resonate as much as tough on crime”?
We know… these are massive questions and we can only begin to scratch the surface of this topic! Here’s our attempt. We started with 40 years of public opinion data on the criminal justice system to determine if there are any particular trends over time. We found some interesting ones which Anthony Piscitelli starts to uncover in this first video of a three-part series looking at the relationship between public opinion of the criminal justice system and crime policy in Canada.
So, what do you think? Does this raise any wicked questions for you? Does public opinion influence political decision making? Or do politicians influence public attitudes?
Footnote: “Wicked questions do not have an obvious answer. They are used to expose the assumptions which shape our actions and choices. They are questions that articulate the embedded and often contradictory assumptions we hold about an issue, context or organization. A question is ‘wicked’ if there is an embedded paradox or tension in the question.” From: Tamarack Learning Centre
Our By the Numbers feature is back with a series of video blogs by Anthony Piscitelli, our very own Supervisor, Planning and Research with the Waterloo Region Crime Prevention Council. In his first video post, Anthony takes a closer look at the numbers from a recent WRCPC publication about crossover children; “From One System to Another: Crossover Children in Waterloo Region.”
If you have more questions, feel free to leave a comment at the bottom of this blog post. Or, you are welcome to give Anthony a call directly. We can be reached at 519.883.2304.

 In 2012, the